
Stocking Density in AquacultureHow Many Fish per Tank
Fish stocking density in kg per m3: typical values by species, what really limits density, how feed becomes waste, and how to size filters from stocking.
 SYSTEM CONCEPT
See the mechanism.
Understand the duty.
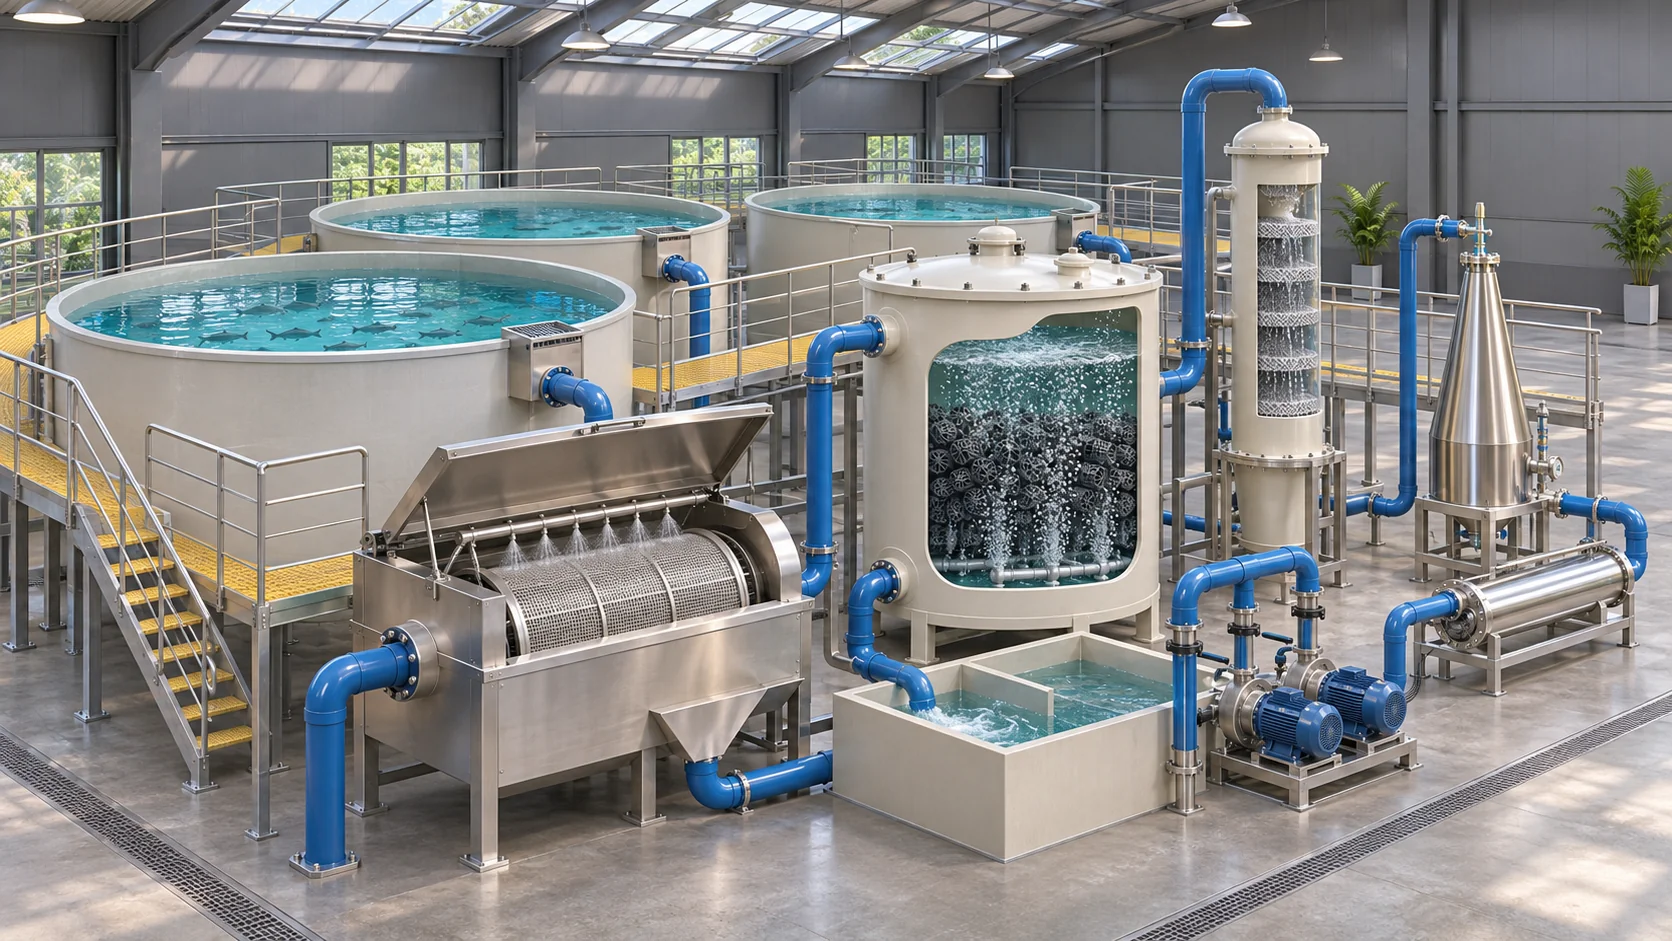
Select a route or a stage to inspect the process. The cutaway explains the equipment and water environment; it is a teaching illustration, not a project drawing.
Culture tanks
Collect waste before it settles.
The culture tank is both an animal environment and a hydraulic vessel. The return flow should distribute oxygenated water and move settleable waste toward the intended outlet. Tank shape, drain arrangement and the behaviour of the stock determine how well this happens.
- Confirm the operating water volume and peak feed.
- Check circulation, drain capture and access for inspection.
- Record oxygen at the animal zone, not only in the return pipe.
Key takeaways
- Density is measured in kg of fish per m³ of water, not number of fish.
- The real limit is oxygen and waste handling, not space.
- Higher density needs pure oxygen, stronger filters and backup.
- Always design from feed load. Density is an outcome.
What is stocking density?
The weight of fish per volume of water, in kg/m³. Because fish grow, density rises over a crop. Systems are designed for the final harvest density.

Typical stocking densities by species
| Species | Typical in RAS | High end | Notes |
|---|---|---|---|
| Nile tilapia | 30 to 80 kg/m³ | About 120 kg/m³ | Aeration alone suits about 30; pure oxygen allows much more |
| Rainbow trout | 20 to 60 kg/m³ | About 80 kg/m³ | Needs lots of oxygen |
| African catfish | 100 to 350 kg/m³ | About 500 kg/m³ | Breathes air |
| Perch and pikeperch | 30 to 60 kg/m³ | About 80 kg/m³ | Sensitive to stress |
Guideline values.
Work with your own numbers.
Use the tools below to explore the relevant arithmetic. Enter measured values or declared assumptions. An estimate does not establish equipment capacity, biological performance or a safe operating limit.
Biomass & observed density
Convert a known count and mean fish weight into biomass and current loading per water volume.
Assumptions and limits
This describes the inputs; it does not establish a safe stocking density or the system’s oxygen, filtration or welfare capacity.
Feed & loading scenario
Translate a selected feeding rate and assumed waste yield into a planning load.
Assumptions and limits
The feeding rate and TAN yield are supplied assumptions. Use the species, feed, growth stage and verified process design; the estimate is not a Pureflow capacity rating.
Convert units before you calculate
Planning arithmetic · inputs remain visible for review · example values are not operating recommendations
What really limits stocking density
From feed to waste: the numbers behind the design
A rough rule is that each kilo of feed produces about 30 to 40 g of total ammonia nitrogen (TAN), uses a few hundred grams of oxygen and creates solid waste. See FCR and waste load.
How to size the drum filter and biofilter
Use feed load, not stocking alone. See drum filter sizing and biofilter sizing.
Stocking density and feed load calculator
Review the design at peak load
Use these questions to prepare a project brief or an operating review. Check an item only when the information has been recorded for your installation.
This checklist is a working aid in the current page session, not a saved maintenance record.
Stocking Density in Aquaculture FAQ
What is a safe stocking density?
It depends on species and system. Start from design limits for oxygen and filtration.
Can I stock more with pure oxygen?
Yes, if filters, CO2 control and backup also scale.
Does higher density always mean more profit?
Only if the system keeps water quality in range.
More guides related to stocking density in aquaculture
Discuss your system with Pureflow.
Share your application, operating volume, actual flow, loading and the question you are trying to resolve.