
Pureflow Bio / Aquaculture engineering
Recirculating Aquaculture
Technology (RAS).
Design the fish, water and operating plan as one system. Explore the treatment loop, test your assumptions and build a clearer project brief.
By Pureflow Bio, Mysuru · India
Engineering guide reviewed 30 October 2026
Understand the complete plant
A fish-production plan. A water-treatment plan.
A recirculating aquaculture system treats culture water and returns it to the stock. Its useful capacity comes from the complete treatment route and the way it is operated.
Connect the production plan to the water-treatment plan: working volume, adult biomass, peak feed, source water, temperature and salinity. Then define what each stage must do under normal service, maintenance and interruption conditions.
The design question
What must this loop handle on its most demanding day?
A tank volume and a filter flow are useful inputs. Neither, by itself, establishes a complete farm’s production capacity.
Water
Reuse with a water budget
Plan make-up, wash water, purge and losses. Recirculation concentrates the need to manage what stays in the loop.
Operation
Control with measurements
Define the operating envelope and the readings that show whether the actual system remains within it.
Integration
Compact with service access
Put valves, screens, instruments and equipment-removal routes into the layout before the plant space is fixed.
| Decision | Flow-through | Pond | Recirculating system |
|---|---|---|---|
| Water route | Continuing source-water flow | Outdoor volume with site-specific inflow and losses | Treated return flow plus planned make-up |
| Environmental dependence | Source-water conditions are a major input | Weather and pond ecology affect operation | More control equipment and operator responsibility |
| Waste handling | Review discharge flow and concentration | Review accumulated material and drainage | Collect filter waste and manage purge water |
| Energy and staffing | Site and gravity head matter | Aeration and husbandry depend on the method | Continuous treatment, monitoring and reliable response |
Further reading: Victorian Fisheries Authority — RAS environmental management. Compare real site designs rather than assuming one method is universally best.
Interactive system explorer
One loop. Separate duties. Connected decisions.
Follow the process, then select a component to see its job and the question its specification must answer.
Process concept, not a construction drawing. Final stage order, side-streams, operating levels and bypass arrangements are project-specific. On a phone, swipe inside the drawing.
Culture tanks
Feed-to-treatment planning studio
Start with the load. See what it asks of the loop.
Compare hydraulic demand with the dissolved-load duty. Every assumption is visible, and the result can travel with your enquiry.
Your live design brief
Hydraulic comparison only. Biological treatment, peak gas demand, mesh-specific duty and system head require separate review.
Scenario A compared with your current inputs
| Metric | Saved A | Current | Change |
|---|---|---|---|
| Feed · kg/day | |||
| Review flow · m³/h | |||
| Media · m³ | |||
| Oxygen · kg/day |
Calculation method, units and the worked example
TAN-N kg/day = feed kg/day × entered g TAN-N/kg feed / 1,000
Turnover flow m³/h = working tank volume / turnover time
TAN-N transport flow m³/h = TAN-N kg/day × 1,000 / (24 × per-pass decrease mg/L)
Review flow = larger of turnover and TAN-N transport flows
Media m³ = TAN-N kg/day × 1,000 / entered media rate
Reactor m³ = media m³ / fill fraction
With 50 kg/day feed, a 30 g TAN-N/kg feed assumption gives 1.5 kg TAN-N/day. A 0.5 mg/L treatment decrease requires 125 m³/h for that load; a 120 m³ tank volume at one-hour turnover requires 120 m³/h. The larger comparison flow is 125 m³/h. At 300 g TAN-N/m³ media/day, the example needs 5 m³ media and 10 m³ working reactor volume at 50% fill.
One mg/L equals one g/m³. This is a steady daily-load balance using the entered per-pass concentration difference. It is not a tank ammonia prediction or a guarantee of biofilter removal. Bypass flows, changing load, side-stream treatment and head losses need separate design.
The alkalinity output uses the theoretical 7.14 kg CaCO₃ equivalent per kg ammonia-N oxidised. It is not a chemical dosing instruction: source-water alkalinity, other treatment reactions and actual measurements affect additions. Nitrification stoichiometry reference.
Oxygen, CO₂ and dry solids use your entered factors. Gas supply divides the oxygen demand by the entered transfer efficiency; peak supply and backup endurance are separate checks. One US gallon = 3.785411784 litres.
Water quality and process control
Set the envelope. Measure the actual conditions.
An operating envelope belongs to the species, life stage and production method. A general table is a starting point for that discussion.
| Parameter | Published example / design basis | Use in the operating record |
|---|---|---|
| Temperature / salinity | Species and life-stage plan | Record seasonal source-water and culture conditions. |
| Dissolved oxygen | Guide example: 70–100% saturation | Set tank limits for species, loading and peak demand. |
| CO₂ | Guide example: 10–15 mg/L | Measure it separately from dissolved oxygen. |
| Un-ionized ammonia | Guide example: < 0.01 mg/L NH₃–N | Interpret TAN-N with pH, temperature and salinity. |
| Nitrite | Guide example: 0–0.5 mg/L NO₂–N | Confirm reporting units and the life-stage operating limit. |
| Nitrate | Guide example: 100–200 mg/L NO₃–N | A general RAS reference, not a universal target. |
| pH | Guide example: 6.5–7.5 | Record trends beside alkalinity and load changes. |
| Alkalinity | Guide example: 70–200 mg/L as CaCO₃ | Review buffering and biological demand together. |
| Suspended solids | Guide example: 10–25 mg/L | Compare the intended production method and separation duty. |
| Flow / level / power | Commissioned baseline and alarm plan | A water-quality record should include equipment state. |
Numerical examples: Bregnballe, 2022, FAO and Eurofish, Table 5.1, printed page 58. Salinity, fry and sensitive species can require different conditions. These are contextual reference values, not recommended alarm settings.
Ammonia-N, nitrite-N and nitrate-N are nitrogen-mass results. Values reported as NH₃, NO₂ or NO₃ have different numerical concentrations. Record the kit or laboratory reporting basis.
Keep time, sampling point, feed, temperature, water addition and recent service beside each result. A single “normal” reading can miss a changing condition.
Explore the freshwater ammonia relationship → Use the chemistry method with the stated units; the koi guide’s care context is separate from farm operating limits.
Fish-health context: UF/IFAS — RAS health management principles.
Species and production method
The species changes the brief. So does the life stage.
Choose a production context to reveal the questions that change the system brief. These profiles do not set stocking densities or promise a harvest.
Species identity, seed sourcing, market route and relevant site permissions belong in the project review. The same scientific species can have different needs at different life stages.
Commissioning and operator handover
Prove the hardware. Establish the biology.
Move from an approved drawing to a demonstrated operating condition. Keep the checks, the evidence and the person responsible together.
Checks are stored on this device when available.
Biological readiness needs its own evidence
Wet commissioning proves the water route, instruments and equipment functions. Establishing and verifying biological activity is a separate task. Use a documented fishless procedure and a test load agreed by the responsible aquaculture team.
Follow ammonia and nitrite through the commissioning period at the actual water conditions. Record the response before introducing a higher production load. A calendar date alone is not an acceptance criterion.
The operator handover should explain how the system normally behaves and what to do when it changes. Keep the readings that define the commissioned baseline with the drawings and supplied service instructions.
Background: UF/IFAS — RAS recommendations and problem-solving. Source-water assessment and appropriate fish-health advice remain part of the operating plan.
Failure and quality workbench
Design the response before the interruption.
A useful failure review follows a simple sequence: prevent the fault where possible, detect it reliably, and rehearse the response.
01 · Prevent
02 · Detect
03 · Respond
Energy and make-up water studio
A useful estimate can be checked against a meter.
Use your equipment duty and local tariff. Compare make-up water with the same clearly defined production scenario.
Energy and water arithmetic
Biomass gain = feed ÷ FCR, an illustrative steady-load denominator. It is not an annual harvest prediction. Energy excludes unentered loads, demand/fixed charges and taxes. Water inputs must not count one loss twice.
Pumps and head
Record actual input at the operating flow and head, including continuous and intermittent loads.
Air and oxygen
Include blowers, oxygen production or purchased gas, transfer equipment and standby provision.
Temperature
Review source-water preparation, building heat exchange and the seasonal heating or cooling duty.
Production costs
Add feed, seed, labour, service, testing, mortality and finance to the business model. Energy alone is not farm profitability.
Pureflow Bio equipment
Select the job. Review the interface. Define the duty.
Explore the equipment by treatment duty. A shared process drawing should show how the selected items work together.
8 equipment families shown
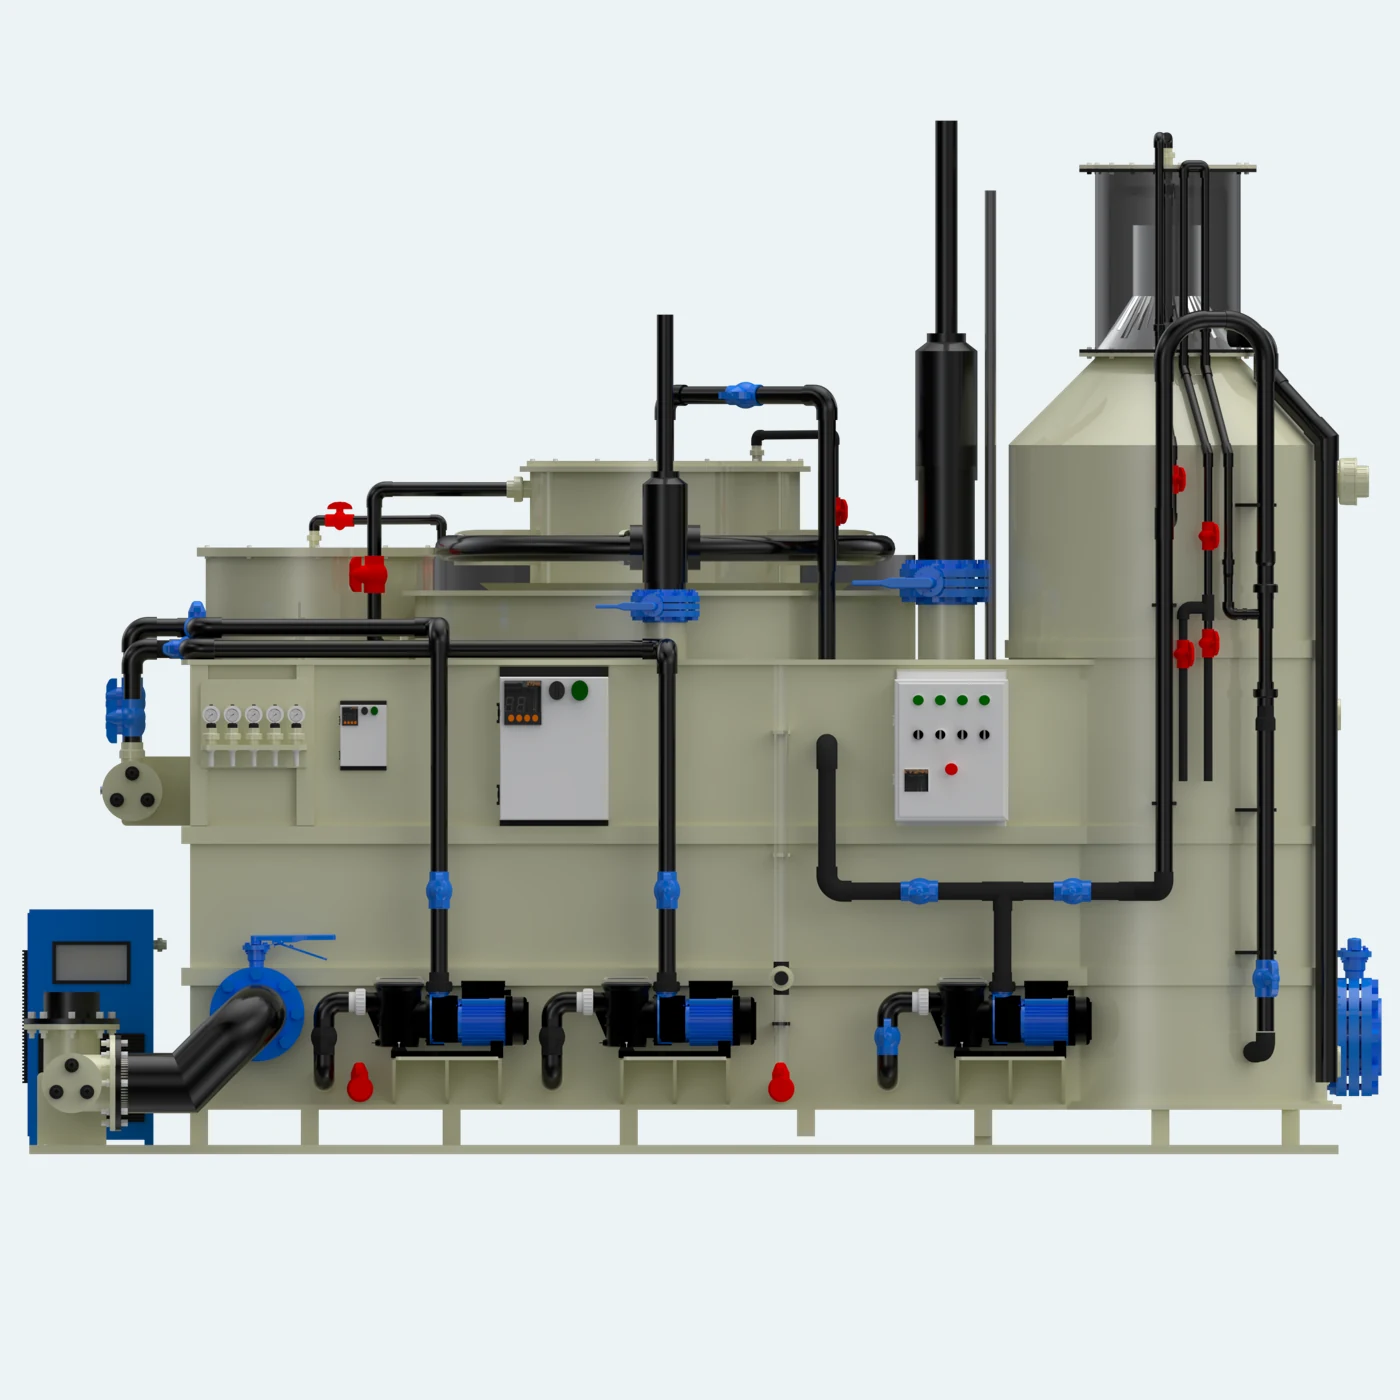
Integrated treatment
RAS skid systems
Coordinate the selected treatment stages, utilities and operating interfaces.
Explore equipment →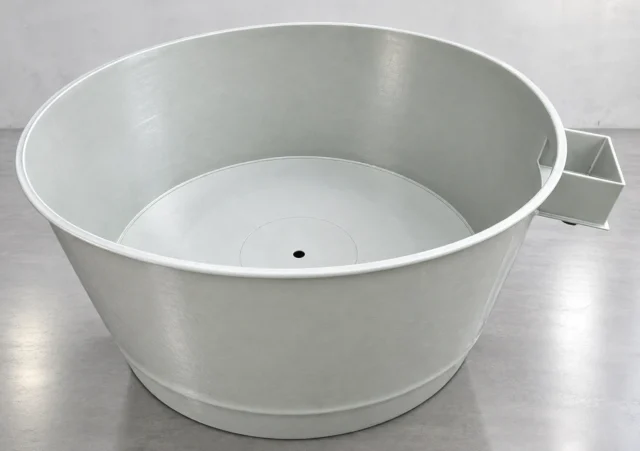
Culture and collection
Aquaculture tanks
Plan working volume, return pattern, isolation and drain access.
Explore equipment →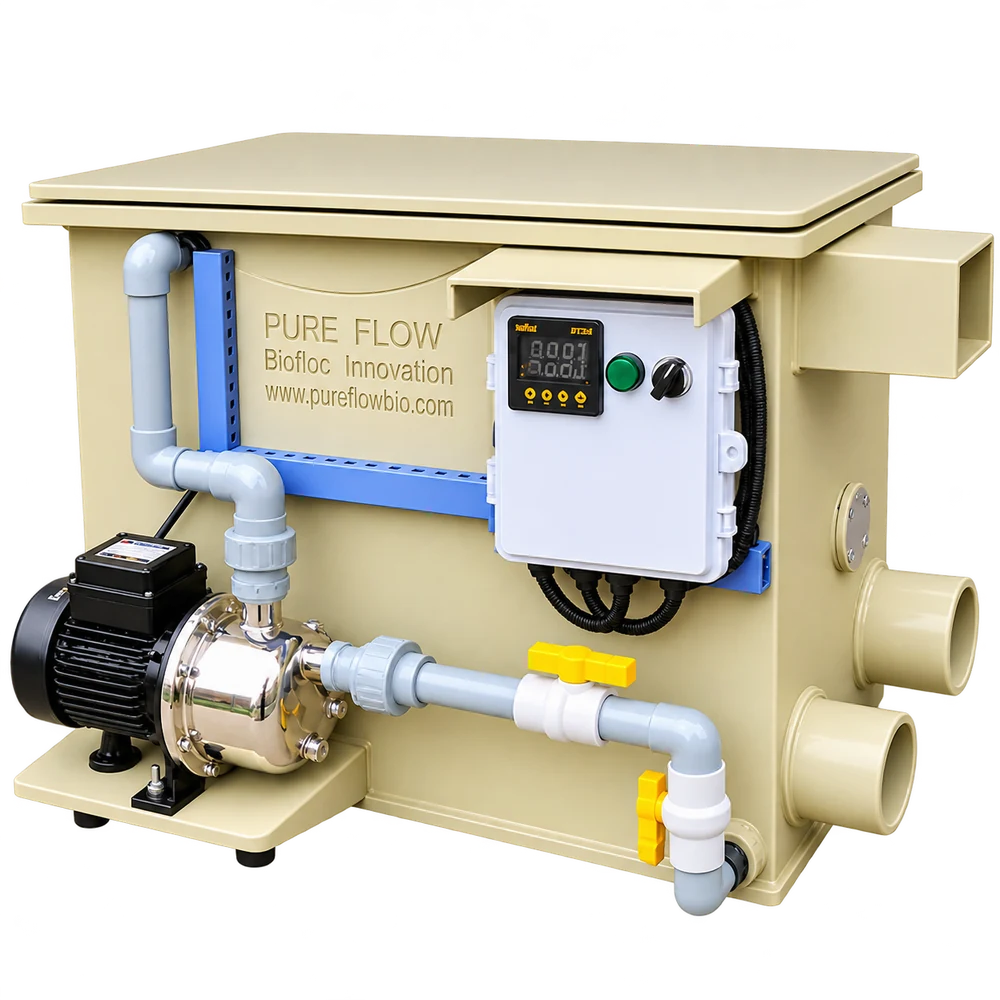
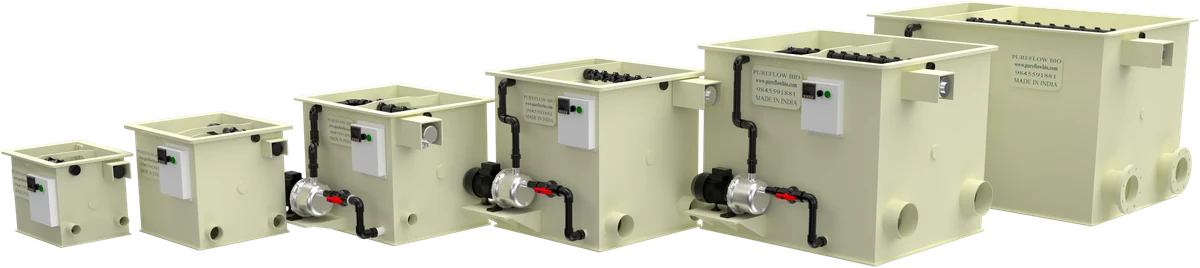
Mechanical separation
Standard drum filters
Compare published hydraulic maxima and review screen-specific duty.
Explore equipment →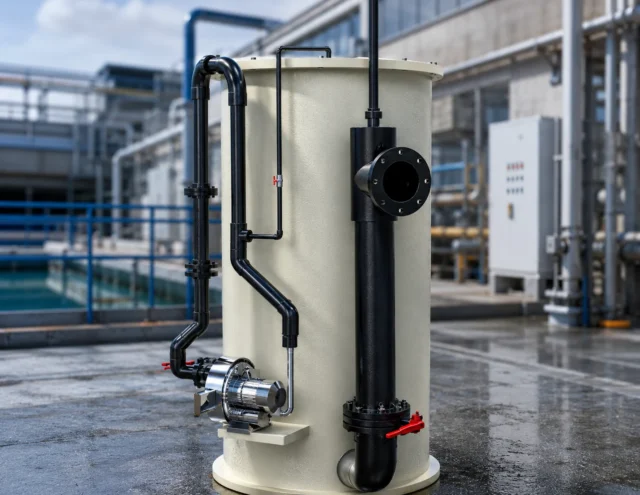
Dissolved nitrogen
Moving bed biofilters
Review media, aeration, fill and the peak biological load.
Explore equipment →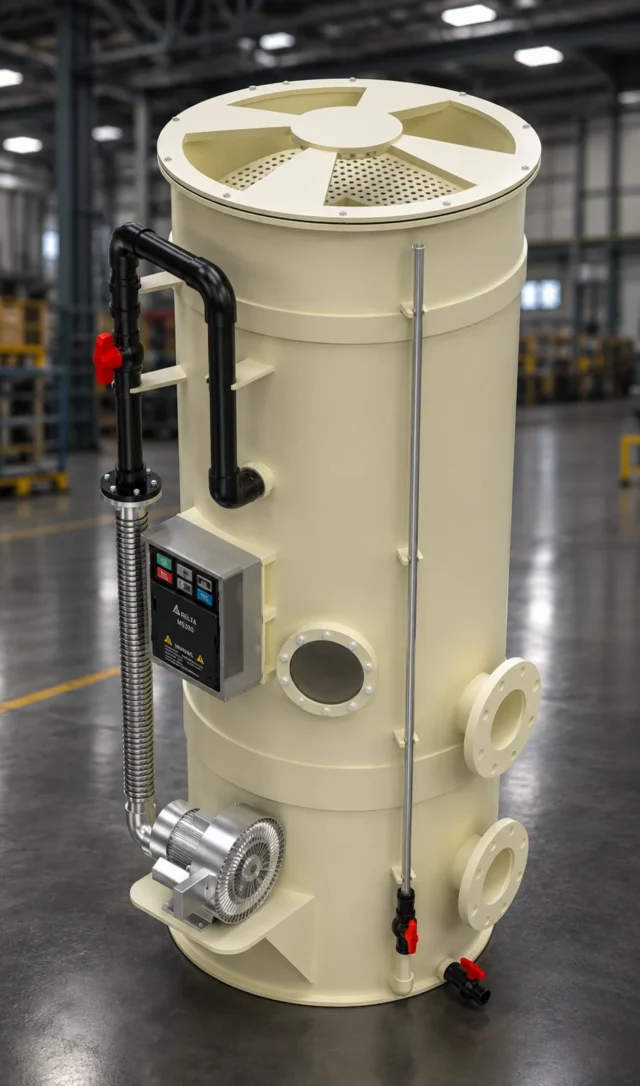
Gas exchange
Degassing towers
Review the CO₂ load, air route, water distribution and exhaust.
Explore equipment →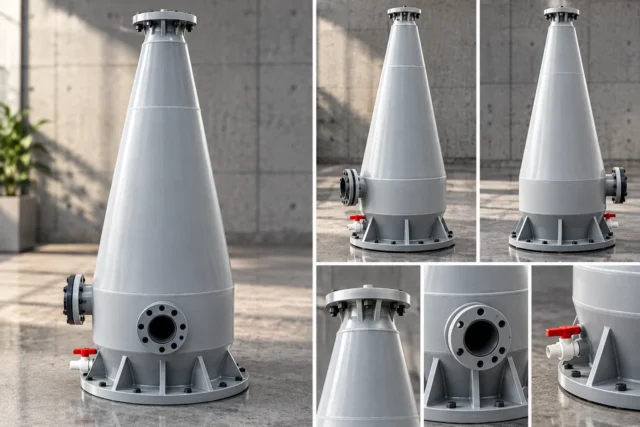
Oxygen transfer
Oxygen cones
Specify transfer duty, gas supply and the emergency arrangement.
Explore equipment →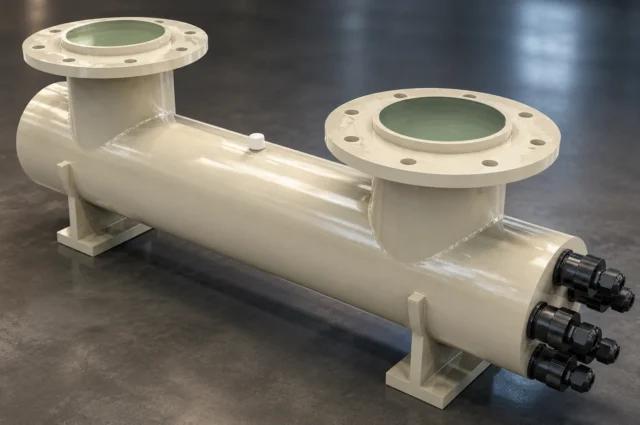
Selected disinfection
UV treatment systems
Confirm treatment purpose, flow and validated water conditions.
Explore equipment →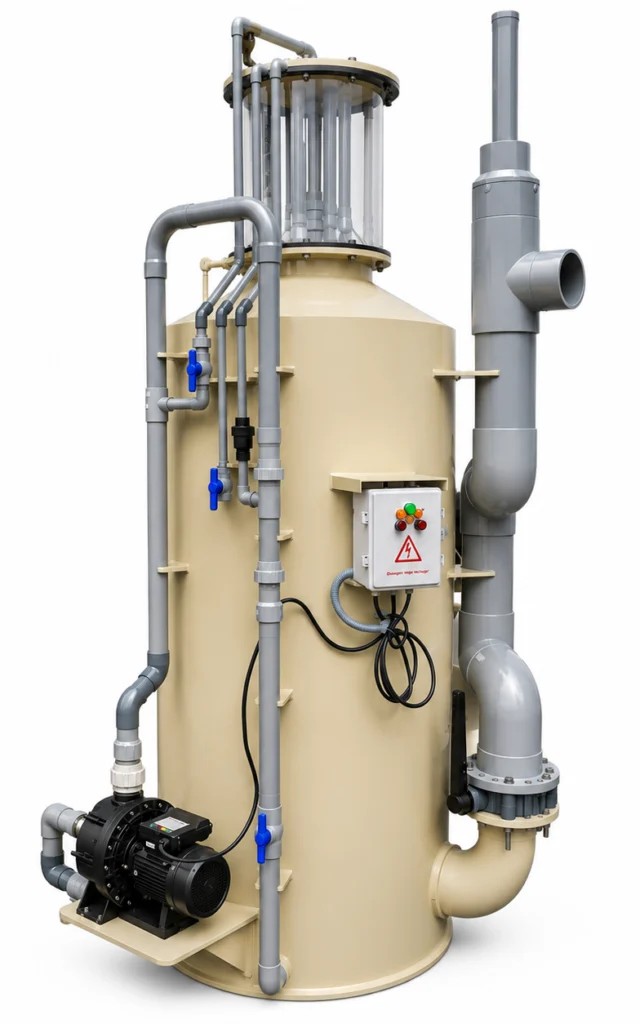
Selected polishing
Protein skimmers
Discuss foam fractionation for the water and organic-load conditions.
Explore equipment →Inside a Pureflow skid arrangement
Open an image to inspect the layout. These are equipment illustrations; the agreed drawing defines the supplied arrangement. No fish-production capacity is inferred from an image or filename.
Technical field guides
Go deeper into the decisions behind the drawing.
Seven practical guides for turning an initial idea into an operating project. Open the topic that matches the next decision.
Market to production planDefine what the farm must deliver.
Start with the buyer, product size, harvest pattern and the species you can reliably source. Translate the production schedule into standing biomass and peak feed rather than assuming every tank is at harvest weight at once.
Separate an annual sales target from the load on one treatment loop. A cohort plan should show introductions, grading, losses, transfers and harvests. That is the basis for discussing both process capacity and operating labour.
Resolve site water, energy, access and discharge alongside the layout. Equipment procurement should follow an agreed design basis, with responsibilities for civil works, utilities and commissioning recorded.
From feed to treatment dutyMake the load visible before selecting hardware.
Use the highest relevant operating feed load, with the actual diet and culture conditions. A daily average can conceal a demanding post-feed period or a large change between cohorts. Record both the mass per day and the feeding schedule.
Treat solids, TAN-N, oxygen and CO₂ as separate duties. Their conversion factors must suit the fish, diet, process and management method. The studio exposes its example factors so that the project team can replace them with an agreed design basis.
Compare the calculated hydraulic requirement with equipment curves and screen-specific ratings. Keep biological acceptance, hydraulic duty and gas-transfer duty separate in the equipment schedule.
Drum screening in a fish farmA screen needs a route for water and a route for waste.
Record the filter-branch flow, screen opening, operating levels and expected solids. Review normal service and an abnormal loaded-screen condition, including what happens if the wash supply or waste discharge stops.
Leave access to the screen, drive, spray bar and sensor surfaces. Nominal housing dimensions do not describe the space needed to remove a component or work around a full filter.
Agree the wash-water source and drainage capacity. The captured solids and wash water belong in the site waste plan rather than an unreviewed connection to the clean return.
Freshwater and marine integrationStart with water chemistry and materials.
Record source-water analysis, seasonal variation and the intended salinity range. Water preparation, material compatibility, instruments and biological commissioning need to match the actual fluid, not only a freshwater or marine label.
Review optional foam fractionation and any ozone circuit by purpose and performance conditions. A side-stream treatment flow should be shown separately from the main circulation flow.
Plan replacement-water preparation and a controlled route for salinity changes. Keep a record of additions so an unexplained change in the main tanks can be investigated.
Biosecurity by layoutDecide which water should be shared.
A common loop connects more than pipes: it also connects the water history of the stock. Decide which cohorts can share treatment and which require quarantine or independent circuits before drawing the main header.
Give each isolation boundary a practical operating method. Identify dedicated nets and hoses, clean and dirty routes, and what will happen to treatment water during cleaning or an investigation.
Keep supplier, arrival, treatment and mortality records with the water results. Professional fish-health support is more useful when the record describes what changed and when.
Start-up and acceptanceCommission the biology as well as the hardware.
Wet tests establish flows, levels, wash cycles, alarms and shutdown behaviour. They should be completed against a written procedure while any shortcomings can still be corrected without exposing stock.
Biological commissioning then demonstrates the agreed treatment response under the defined temperature, salinity and water conditions. A calendar estimate can help scheduling, but the acceptance record must show the actual result.
Introduce the production load in agreed steps and compare water results with the approved envelope. The handover should contain the baseline record, maintenance instructions and a tested response to critical faults.
Energy, harvest and operating reviewUse a model that can be checked against the meter.
Build an electrical-load schedule for pumps, air, gas, UV, controls and temperature equipment. Record which loads run continuously and which cycle; use measured input where it is available.
Compare energy with a clearly defined production denominator. Estimated biomass gain from feed and FCR is a modelling assumption; it is not the same as an annual harvested tonnage or a verified farm result.
Include feed, seed, oxygen, labour, service, mortality, water, testing and finance in the commercial review. The page’s energy calculator deliberately reports energy and water arithmetic rather than a promised profit or payback.
Questions answered
Practical answers for recirculating aquaculture.
18 answers available
What is a recirculating aquaculture system (RAS)?
It is a fish farm in tanks where water is cleaned and reused instead of being let out. Waste solids are screened out, ammonia is converted by a biofilter, carbon dioxide is removed and oxygen is added before water returns to the fish.
What are the main parts of a RAS?
Fish tanks, a drum filter for solids, a biofilter for ammonia, a degassing stage for carbon dioxide, oxygenation, UV or ozone for disinfection, pumps, and monitoring with backup power. Each part is sized to the daily feed.
Why is RAS sized by feed and not by tank volume?
Almost all waste comes from feed. The amount of feed given each day sets how much ammonia, solids and carbon dioxide the system must handle, so feed is the number every component is designed around.
How much water does RAS save?
Most water is reused, and only a small daily top-up replaces what's lost to filter waste and evaporation, far less than a pond or flow-through farm. That makes RAS possible where water is scarce or expensive.
What are the biggest running costs?
Usually feed, then electricity for pumps and blowers, oxygen, seed and labour. Efficient pumps and good design keep power costs under control.
What can go wrong in a RAS?
The biggest risks are power or pump failure, a biofilter crash and disease. Backup power, alarms, standby pumps, good biosecurity and steady management prevent most problems.
Can I start with a small RAS?
Yes, and it is a sensible way to learn. A small unit or skid lets you master daily management and test your market before investing in a large farm.
Which species can be grown in RAS?
Many freshwater and marine species, including tilapia, pangasius, murrel, seabass, trout, ornamental fish and shrimp. The best choice depends on market price, seed supply and your climate.
Engineering in plain language
Use the same terms in the brief and the quotation.
- RAS
- Recirculating aquaculture system: culture water is treated and returned for reuse.
- Peak feed load
- The daily feed and feeding pattern selected for the demanding design condition.
- Standing biomass
- The mass of live stock present in the defined tanks at a stated time.
- Turnover
- Time for a water volume equivalent to the culture tanks to pass through a stated circuit.
- TAN-N
- Total ammonia nitrogen, combining ammonia and ammonium expressed as nitrogen mass.
- Per-pass decrease
- The concentration difference between the inlet and outlet of a defined treatment stage.
- Media treatment rate
- TAN-N duty per unit of the specified media at defined operating conditions.
- Reactor fill
- Media volume divided by working reactor volume, expressed as a fraction or percentage.
- Oxygen transfer
- Movement of oxygen from the gas supply into the water under the operating conditions.
- System head
- The hydraulic energy the pump must provide for elevation, friction and equipment losses.
- FCR
- Feed conversion ratio: feed mass divided by biomass gain over a defined period.
- Make-up water
- New water added to replace the defined purge, wash demand and other losses.
Project enquiry
Turn the scenario into a reviewable RAS brief.
Bring the production plan, the water information and the site interfaces together. The planning studio’s enquiry button includes its calculated brief here.
A clear project handover includes
01
An agreed design basis
The stock, feed, operating envelope and treatment duty used to select the system.
02
A coordinated interface schedule
Water levels, utilities, drainage, access and the responsibility for each connection.
03
A witnessed acceptance record
Documented equipment, biological and alarm checks, with supplied operating and service instructions.
Sources and review
A traceable basis for the next discussion.
Original Pureflow Bio process illustrations, planning tools and project guidance, reviewed 30 October 2026. Source links provide context; they do not imply endorsement of Pureflow products. Calculator defaults are labelled illustrative inputs and can be changed.
- FAO / Eurofish — recirculation aquaculture ↗
Bregnballe, 2022, third edition. Table 5.1 provides the contextual freshwater reference values used above. - UF/IFAS — RAS fish-health principles ↗
Background on source-water assessment, biological establishment and water-quality management. - UF/IFAS — problem-solving and operation ↗
Background for commissioning and systematic review of operating changes. - Victorian Fisheries Authority — RAS environmental management ↗
Context for site water, waste routes, monitoring and operating responsibilities. - CWEA — nitrification and alkalinity ↗
The theoretical alkalinity factor used in the studio. Its wastewater operating ranges are not applied as fish-culture targets. - Pureflow Bio — published equipment ↗
Equipment families, individual product information and project quotation scope.
Plan the complete system
Connect the load.
The loop. The operator.
Make the next conversation about a clear design basis.