
Feed Conversion Ratio and Waste LoadWhy Feed Sets Your Filter Size
How FCR links feed to growth and waste, and why daily feed is the best starting point for sizing filters and oxygen supply.
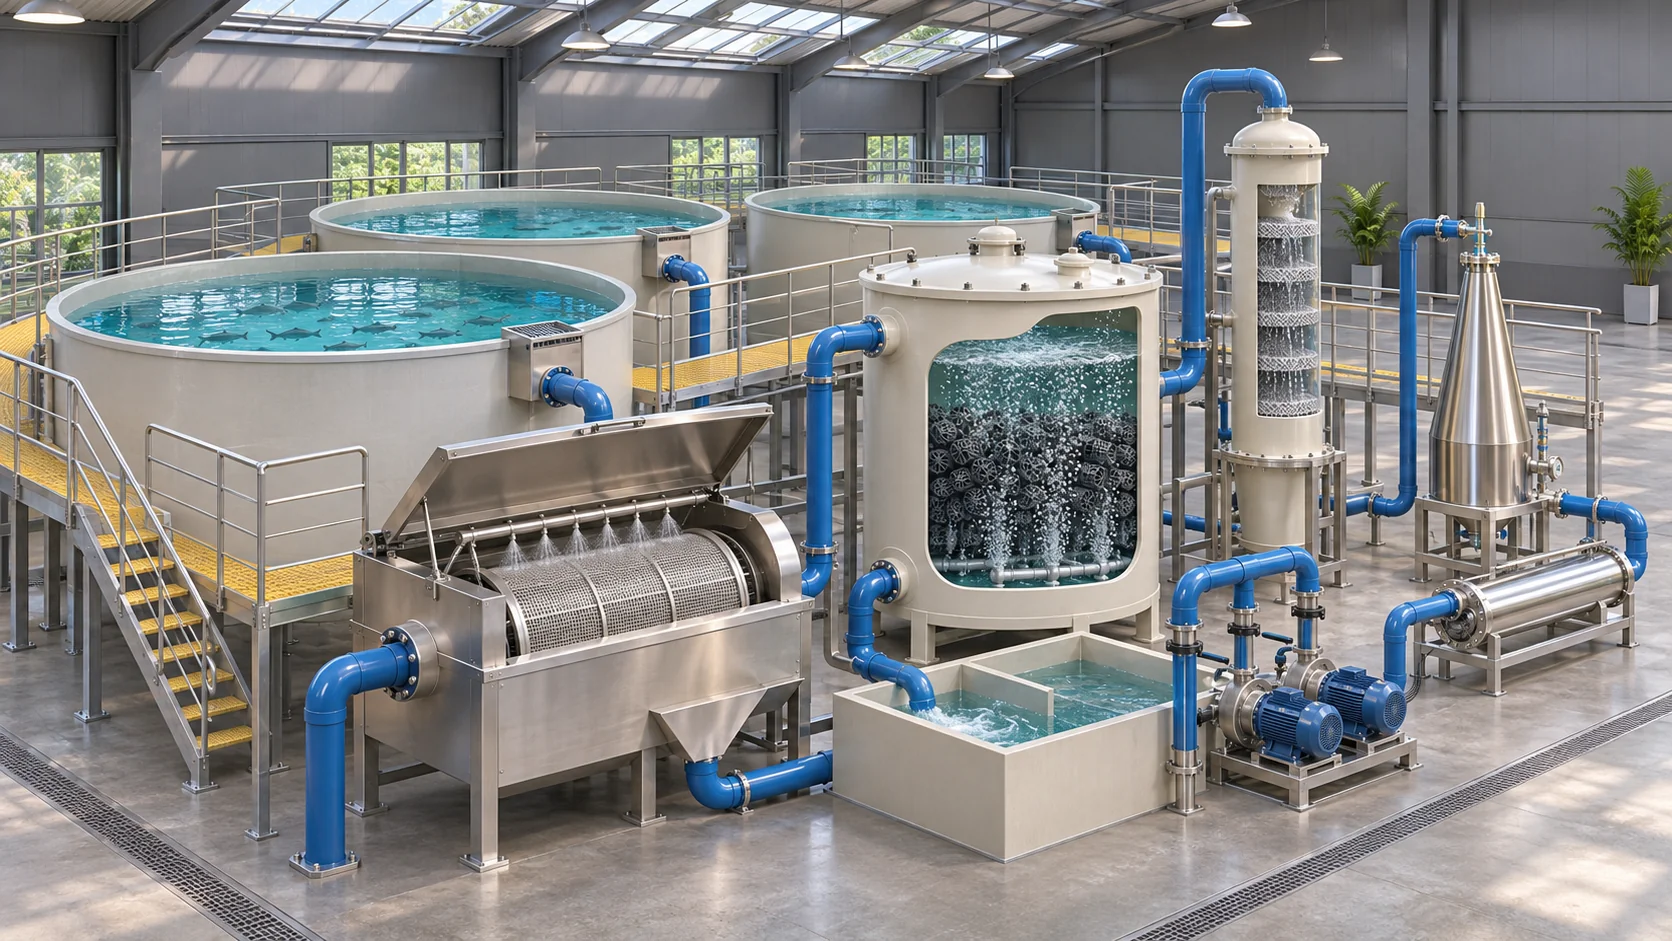 SYSTEM CONCEPT
See the mechanism.
Understand the duty.
Select a route or a stage to inspect the process. The cutaway explains the equipment and water environment; it is a teaching illustration, not a project drawing.
Culture tanks
Collect waste before it settles.
The culture tank is both an animal environment and a hydraulic vessel. The return flow should distribute oxygenated water and move settleable waste toward the intended outlet. Tank shape, drain arrangement and the behaviour of the stock determine how well this happens.
- Confirm the operating water volume and peak feed.
- Check circulation, drain capture and access for inspection.
- Record oxygen at the animal zone, not only in the return pipe.
Key takeaways
- What FCR is: Feed conversion ratio is the weight of feed you use per kilogram of weight the fish gain.
- Feed becomes waste: Fish keep only part of what they eat.
- Using it for design: Estimate peak daily feed, then size the drum filter, the biofilter and oxygen supply for that load, with margin.
- Improving FCR: Feed the right size of pellet, avoid overfeeding, keep water quality good so fish eat well, and record feed and growth every week.
What fcr is
Feed conversion ratio is the weight of feed you use per kilogram of weight the fish gain. A lower number means less feed is wasted for the same growth.

Feed becomes waste
Fish keep only part of what they eat. The rest leaves as solids and dissolved nitrogen, which becomes ammonia. More feed means a bigger load for the drum filter, biofilter and oxygen supply.
Work with your own numbers.
Use the tools below to explore the relevant arithmetic. Enter measured values or declared assumptions. An estimate does not establish equipment capacity, biological performance or a safe operating limit.
Observed feed conversion ratio
Calculate a period FCR using recorded feed and net biomass gain over the same period.
Assumptions and limits
Use a consistent stock accounting method and include movements and mortality where appropriate. This is an observed ratio, not a growth forecast.
Feed & loading scenario
Translate a selected feeding rate and assumed waste yield into a planning load.
Assumptions and limits
The feeding rate and TAN yield are supplied assumptions. Use the species, feed, growth stage and verified process design; the estimate is not a Pureflow capacity rating.
Convert units before you calculate
Planning arithmetic · inputs remain visible for review · example values are not operating recommendations
Using it for design
Estimate peak daily feed, then size the drum filter, the biofilter and oxygen supply for that load, with margin.
Improving fcr
Feed the right size of pellet, avoid overfeeding, keep water quality good so fish eat well, and record feed and growth every week.
Review the design at peak load
Use these questions to prepare a project brief or an operating review. Check an item only when the information has been recorded for your installation.
This checklist is a working aid in the current page session, not a saved maintenance record.
Feed Conversion Ratio and Waste Load FAQ
What is a good FCR?
It varies by species and feed. Compare it with figures from your own farm over time.
Does poor water quality raise FCR?
Yes. Stressed fish eat less efficiently.
More guides related to feed conversion ratio and waste load
Discuss your system with Pureflow.
Share your application, operating volume, actual flow, loading and the question you are trying to resolve.